The System Activity Reporter, sar, can display a lot of information about your computer and save that information to files for later analysis. This program and its related tools are part of the sysstat package.
When you install sysstat, a file named sysstat is added to the /etc/cron.d/ to call sar automatically. On Debian and most other distributions, the program is scheduled to run both at 10-minute intervals and once per day at 23:59. Depending on your distribution, sar is not called directly, but instead, one of its two default scripts, sa1 or sa2, runs. These scripts collect various statistics and accept varying types of input values, which are configured in the /etc/default/sysstat configuration file.
Performance data collected by sar is logged to a file. By default, those files are saved to the /var/log/sa directory. In that directory, you find files named sa1, sa2, sa3, and so forth, where the number represents the day of the month. Thus, with this scheme, a month’s worth of past data is available for review until that data is overwritten with new data.
Installing sar
Let’s take a look at how to install and use sar if not already installed on your system.
1. Install the sysstat package using the following command for a Debian-based distribution:
# sudo apt-get install sysstat
We can also use the following command for a RHEL-based distribution:
# sudo yum install sysstat
2. Edit the /etc/default/sysstat file with your favorite text editor and change the following value from:
ENABLED="false"
To:
ENABLED="true"
3. Restart the sysstat service using the following command:
# service sysstat restart
sar command usage
The typical use of the sar command itself is either to display realtime data or to view the contents of one of the log files. If you enter sar by itself, the command outputs the current day’s log file. You can get current data with the following command:
# sar interval iterations
Where,
interval is an interval in seconds.
iterations is a number of times to make and output statistics.
An example is shown below.

sar Command examples
In addition, you can use various command options with sar to display additional information or control the program’s operations. A few of the more common options are listed in the following table.
| Option | Displayed statstics |
|---|---|
| -A | All |
| -b | I/O |
| -B | swap |
| -d | I/O for each block device on the system |
| -n ALL | All network statistics. Instead of ALL, you can use DEV (device), NFS (network file system), SOCK (sockets), and additional options to display subsets of network data. |
| -q | Processor queue (cache) |
| -r | Memory and swap |
| -u | CPU (the default when no options are specified) |
| -v | Kernel |
| -W | Simplified swap statistics (pages swapped in and out per second only) |
Example 1: View CPU Statistics
Use the following command to view basic CPU statistics, including wait times:
# sar -u 1 10
This should produce an output that looks similar to the following screenshot:

Example 2: View Memory Statistics
Use the following command to view the available memory statistics:
# sar -r 1 10
This should produce the following output:

Example 3: View I/O Stats
Seeing the IO stats for individual block devices can be helpful when tracking down performance issues. You can use the following command to view these statistics with sar:
# sar -b 1 10
This will produce an output similar to the following screenshot:

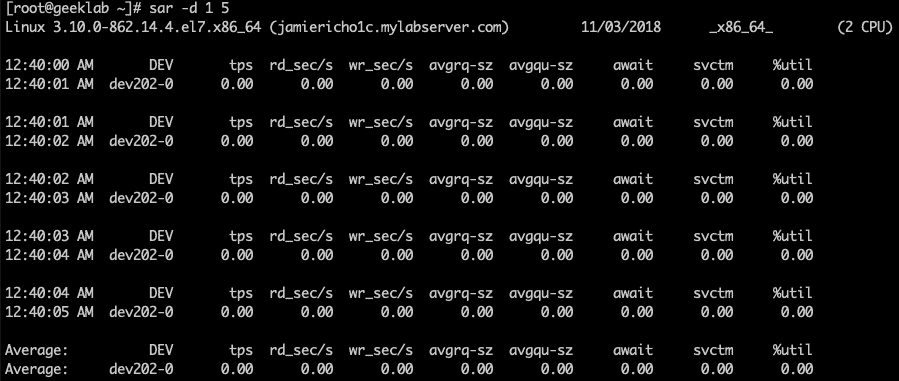
Example 4: View Disk Device Status
Show the disk device status every 1 seconds with this command:
# sar -d 1 5
